PORTLENS BLOG
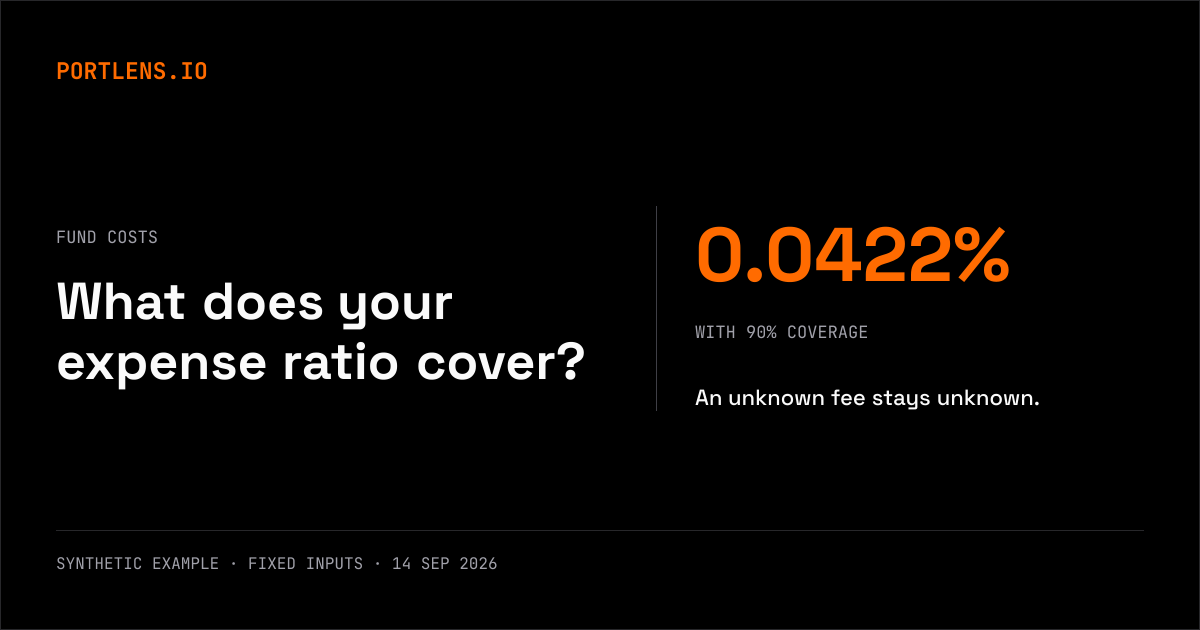
Weighted Portfolio Expense Ratio: Why Coverage Matters
A weighted expense ratio needs a clear denominator. Calculate fund costs, distinguish missing fees from zero, and read portfolio coverage correctly.
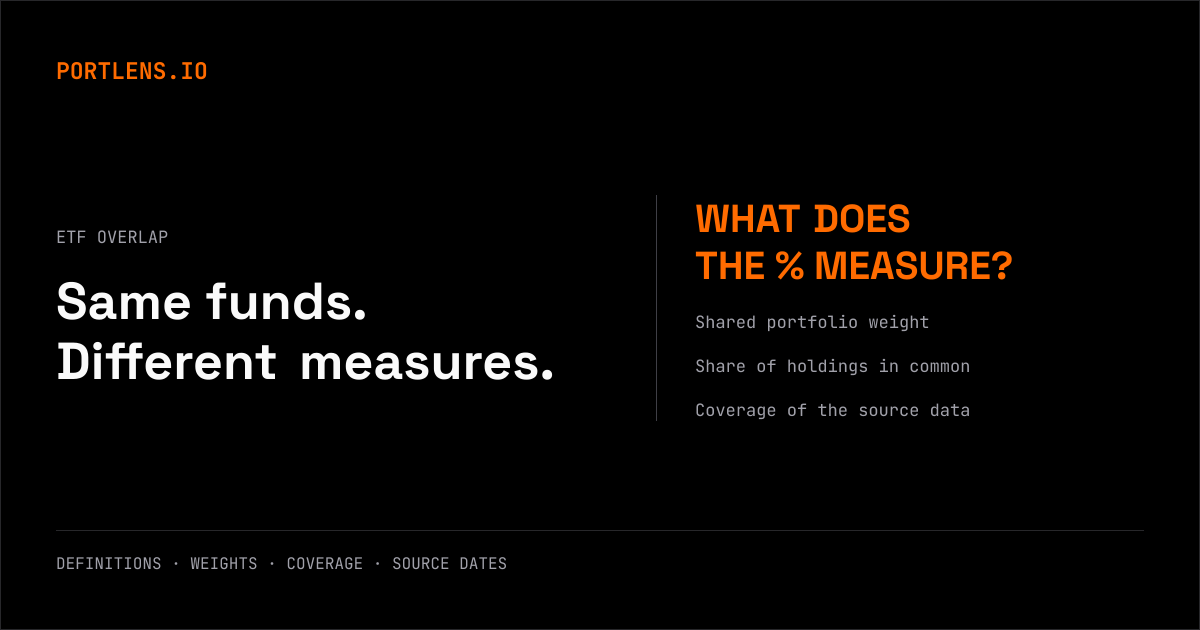
Why Do Two ETF Overlap Percentages Disagree on the Same Funds?
ETF overlap percentages can answer different questions. Compare four dated SCHD–VOO readings, their definitions and the holdings coverage behind them.

Portfolio Tracker Without Linking Accounts: Why Manual Entry Is the Point
Analyze your portfolio with tickers and share counts, without linking a brokerage account. See what manual entry reveals and where coverage is limited.

Does the S&P 500 Return Include Dividends? Price vs. Total Return
The headline S&P 500 excludes dividends; its total-return index reinvests them. Compare the two and see how your portfolio benchmark changes the result.
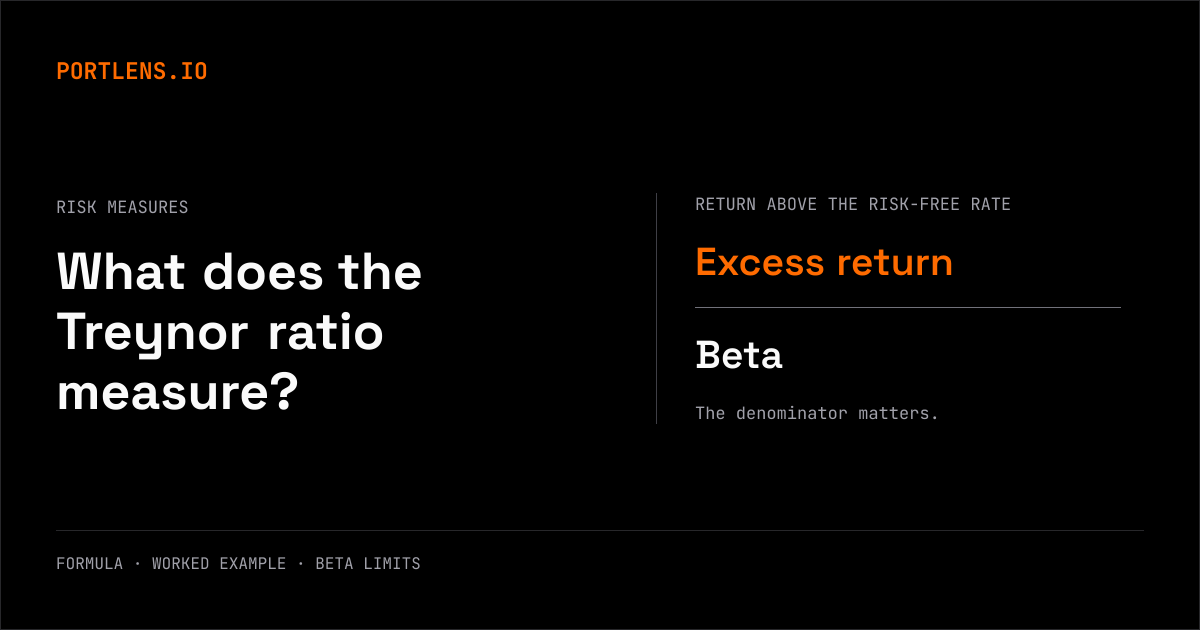
What Is the Treynor Ratio? Formula, Worked Example, and What Counts as Good
The Treynor ratio divides return above the risk-free rate by beta. Follow a worked example and learn when low or negative beta makes it misleading.
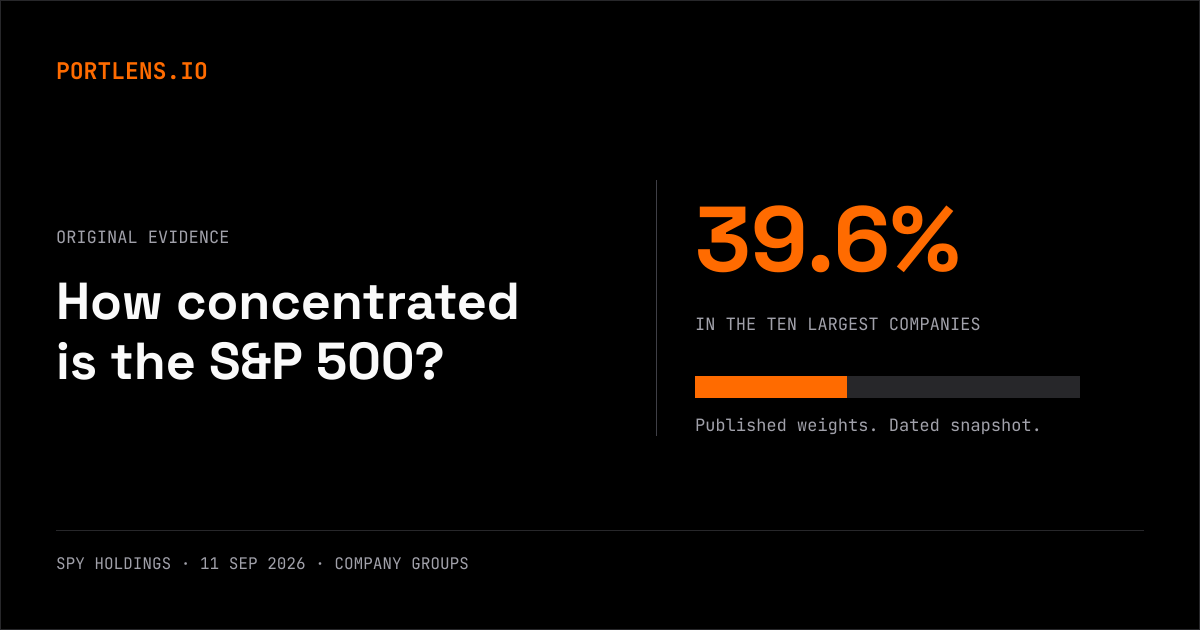
S&P 500 Concentration Risk: The Top Ten by Weight
SPY’s ten largest companies held 39.6% on September 11, 2026. Compare two dated snapshots and check concentration in your own portfolio.

What Happened to Morningstar's Instant X-Ray, and What a Portfolio X-Ray Shows
A portfolio X-ray reveals holdings inside your funds. See what replaced Morningstar’s free tool and follow a worked example of hidden Apple exposure.

What Is ETF Overlap? How to Check It and How Much Is Too Much
ETF overlap measures the investments two funds share. Learn the weighted-overlap formula, compare fund pairs and check exposure across your portfolio.

How to Calculate Portfolio Beta (With a Worked Example)
Calculate portfolio beta as a weighted average. Follow a worked example, check the benchmark and understand missing data and other limits.

Diversification Beyond Sector Splits: Factors, Geography, and Correlation Regimes
Sector labels can hide shared portfolio risks. Check company concentration, geography and factor exposure, with clear limits on what each measure shows.

The Minimum Variance Frontier, Explained Simply
The minimum variance frontier shows the lowest estimated risk for each expected return. Learn the intuition, assumptions and practical limitations.

Factor Exposure: The Risk Your Sector Breakdown Hides
Market, size and value factors can link stocks across sectors. Learn how factor exposure is measured and what a portfolio regression can tell you.

What Is Real Diversification? (It's Not the Number of Stocks You Own)
More holdings can still mean concentrated risk. Compare position count, effective holdings and shared exposures, then check your own portfolio.