What Is ETF Overlap? How to Check It and How Much Is Too Much
ETF overlap measures the investments two funds share. Learn the weighted-overlap formula, compare fund pairs and check exposure across your portfolio.
On this page
ETF overlap is the percentage of two funds' portfolios that is invested in the same underlying stocks. It matters because owning several overlapping funds concentrates your portfolio invisibly: your brokerage statement shows three or four tidy ticker symbols, while underneath, the same handful of mega-cap stocks may dominate all of them.
The pair comparisons preserve a June 30, 2026 holdings snapshot using the complete lists published by the issuers. Each linked pair page shows its current result and source dates. The whole-portfolio example uses a separately dated September 8, 2026 calculation, with the methodology and holdings dates beside it.
How is ETF overlap measured?
The standard measure is overlap by weight: for every stock held by both funds, take the smaller of its two portfolio weights, then add those minimums up. Summed across every shared holding, this tells you what fraction of your money is effectively invested identically in both funds.
Take SPY and VOO, two funds tracking the S&P 500. NVIDIA is 8.00% of SPY and 7.51% of VOO, so it contributes 7.51 points of overlap. Apple is 6.92% and 6.59%, contributing 6.59. Repeat across all 500 stocks the two funds share and the total comes to 93.7%. Put $10,000 into each and roughly $9,370 of the second position is invested identically to the first.
Counting shared names instead overstates how different two funds are — and sometimes gets the answer backwards. VB and VTI share 765 holdings, yet they overlap by just 11.3% of weight: VTI's money sits in mega-caps, and the small-cap names the two funds share are a rounding error inside it. VTV and VUG share only 21 names and overlap by 3.7%. Weight, not name count, is what determines how a pair behaves.
How much do popular ETF pairs actually overlap?
| Pair | Overlap by weight | Shared stocks | What it means |
|---|---|---|---|
| SPY vs VOO | 93.7% | 500 | Same index; separate funds with heavily shared holdings |
| VOO vs VTI | 86.9% | 498 | Total market ≈ S&P 500 plus a small-cap sliver |
| VGT vs XLK | 81.3% | 73 | Two tech sector funds, heavily redundant |
| VOO vs VUG | 57.5% | 121 | Growth fund is the index's top half, concentrated |
| VOO vs VYM | 33.6% | 254 | Genuine common ground, different center of gravity |
| VB vs VTI | 11.3% | 765 | Many shared names, almost no shared weight |
| VTV vs VUG | 3.7% | 21 | Value and growth; little shared company weight |
| VTI vs VXUS | 1.1% | 64 | US and ex-US — near-disjoint by construction |
Every pair page shows the top shared holdings with each fund's exact weights, where the sector exposures differ, and the constituent coverage behind the numbers. Browse all pairs on the ETF overlap hub.
Why does ETF overlap matter at the portfolio level?
A single overlapping pair may give you little beyond another line item to track. The larger issue shows up across the whole portfolio, because overlap compounds in a way pairwise checks do not reveal: each fund can look like a reasonable addition to every other fund while all of them load the same names.
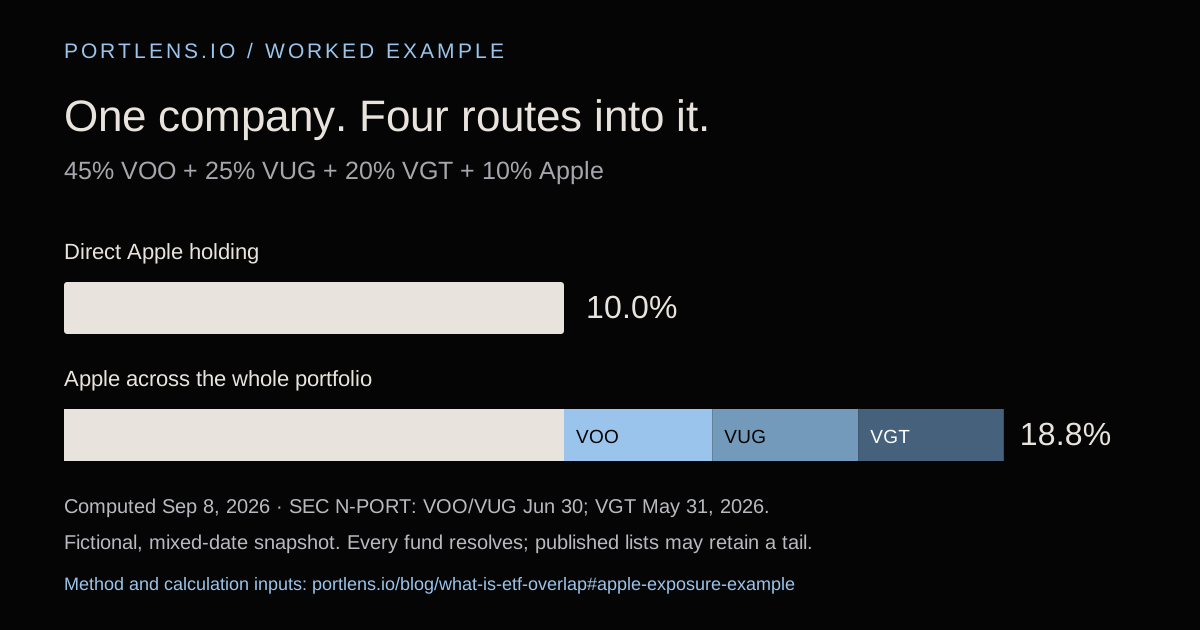
Take a fictional allocation of 45% VOO, 25% VUG, 20% VGT and 10% Apple. The direct Apple line says 10%. Once you include its positions inside all three funds, Apple accounts for 18.8% of the portfolio.
PortLens computed this example on September 8, 2026 using SEC N-PORT holdings dated June 30, 2026 for VOO and VUG, and May 31, 2026 for VGT. Those are different snapshots, not live holdings. The calculation follows our methodology.
| Route to Apple | Portfolio allocation | Apple's weight inside the fund | Contribution to portfolio |
|---|---|---|---|
| VOO | 45% | 6.590% | 2.965% |
| VUG | 25% | 11.669% | 2.917% |
| VGT | 20% | 14.568% | 2.914% |
| Direct Apple holding | 10% | N/A | 10.000% |
| Combined | 18.796%, or 18.8% rounded |
The full-source calculation returns 100% look-through coverage for this sample: every fund resolves. That does not certify every underlying asset's weight or guarantee the same coverage for other portfolios. Published lists can retain an unattributed tail, and share classes can appear separately. The result is a saved snapshot of a fictional allocation, never a suggested portfolio.
You can download the calculation inputs as CSV and open the chart as SVG. The CSV uses fractions throughout: multiply each portfolio weight by Apple's weight within that position, sum the four contributions, then multiply by 100. It preserves the unrounded contributions from the saved example; it is not a download of the funds' full holdings files.
To cite this example: PortLens Team, “What Is ETF Overlap?”, fictional portfolio calculation prepared September 8, 2026, published by Finsight Labs Ltd at PortLens.io. Link to this calculation and its source dates. The conclusion applies to this allocation and these dated holdings, not to portfolios in general.
Inputs and contributions in the table are rounded separately; the calculation uses unrounded weights. The funds add about 8.8 percentage points to the direct Apple position. A pairwise overlap percentage cannot tell you that total because it does not know your allocation or your direct stocks.
You can explore the clickable example on the homepage, or check the underlying company exposure in your own portfolio. The free scan accepts up to 20 holdings without an account and reports its own coverage.
How much overlap is too much?
No percentage is universally too much. Overlap by weight measures shared holdings; it does not establish a suitable allocation for you. A useful reading needs the measure's definition, your position sizes, and the rest of your portfolio.
A 90% overlap between two positions that are each 1% of your portfolio contributes little to the whole portfolio's concentration. The same overlap between your two largest positions can dominate it. These are illustrative weights, and the distinction comes from the allocation rather than from a cutoff.
The bands shown on PortLens pair pages are descriptive interface choices. They are not academically established targets, risk grades, or instructions to trade. The investigation of differing overlap percentages shows why applying a threshold before identifying the measure can produce contradictory answers.
What can I learn from funds that overlap?
You can learn which companies recur, how much each route contributes, and how much of the portfolio the data covers. Those are checkable observations.
Read the largest combined company positions first. Then trace each one back to the funds and direct stocks that created it. Finally, check the holdings dates and unresolved weight. A large position from two dated files means something different from a result based on a small approximation of either fund.
That gives you a description of the concentration you actually measured. It does not decide which position to keep, add or sell. All investing involves risk, including possible loss of principal, and past performance does not guarantee future results.
Is ETF overlap the same as correlation?
No, and conflating them is the most common mistake in this area. Overlap is a holdings measure: how much of the same stock do these two funds own? Correlation is a behavior measure: do their returns move together?
The relationship runs one way only. High overlap usually suggests high correlation, but the holdings snapshot here cannot by itself establish a historical or future return relationship; correlation must be estimated from returns over a stated time window. But low overlap implies nothing at all about correlation. VTI and VXUS overlap by 1.1%, essentially disjoint baskets of US and international companies, and they are still both equity funds exposed to the same global risk appetite. In a broad risk-off move, "different holdings" is not much protection.
Overlap answers am I buying the same companies twice? Correlation answers have these moved together over the window you measure? You need both, and they fail differently — a portfolio can pass the overlap check and still be one bet, which is the subject of diversification beyond sector splits and factor exposure.
What doesn't overlap by weight tell you?
The measure is precise about a narrow question, and knowing its edges keeps you from over-reading it.
- It is bounded by data coverage. Overlap can only count holdings that are published. The VTI vs VXUS comparison covers 98% of VTI's weight but only 81% of VXUS's, so the true figure could be modestly higher. Every computed pair page states its coverage; a checker that does not publish one is asking you to trust a number you cannot audit.
- Even separate twin funds don't compute at 100%. Issuer files are snapshots taken on their own schedules and rounding conventions. Microsoft is published at 5.60% of SPY and 4.30% of VOO for the same date, and the smaller weight is the one that counts — which is why two registered funds tracking an identical index land in the low-to-mid 90s rather than at 100.
- Share classes count as separate names. Alphabet appears twice in the SPY/VOO table, as GOOGL and GOOG. Overlap is computed per ticker, so one company can look like two positions.
- It is silent about your position sizes. A pair page knows nothing about how much of each fund you own, and that is what converts a percentage into a real exposure.
- It is pairwise. Three-way stacking hides between the pairs, as the worked example above shows.
- It is a snapshot, not a forecast. Index reconstitutions and drift move these numbers; read each example's source dates above.
How do I check ETF overlap in my own portfolio?
For a single pair, use an overlap checker that publishes the underlying numbers — shared holdings, each fund's weights, and data coverage — rather than a bare percentage. When PortLens publishes a computed figure, the overlap page shows all of this from full issuer or SEC filing constituent lists, with the method documented in our methodology.
For a whole portfolio, pairwise checks aren't enough, because stacking hides between the pairs. A portfolio-level look-through explodes every fund into its constituents and sums your exposure to each underlying company across every position. That produces the numbers that actually describe your concentration:
- your effective number of holdings — a top-heavy portfolio of twelve positions can behave like four;
- the share of your money in your ten largest underlying companies;
- which underlying companies appear in more than one of your holdings, how many funds each appears in, and whether you also hold it directly;
- how much of the portfolio could be looked through at all, so you know what the figures rest on.
The free scan computes these measures for the holdings you enter, with its coverage limits shown alongside the result.
Key takeaways
- Overlap by weight adds the smaller weight of each shared holding. Counting names answers a different question.
- Position sizes turn pair overlap into portfolio exposure; no universal percentage decides whether your allocation is suitable.
- The dated four-position example turns 10% held directly in Apple into 18.8% combined exposure after looking through the three funds.
- Low overlap does not mean low correlation. Funds can hold different companies and still move together.
- Read the source dates and coverage with every figure. A resolved fund can still have an unattributed tail in its published list.
This article is for information and education only and is not investment advice. Analytics referenced are computed as described in our methodology; see our disclosures.