S&P 500 Concentration Risk: The Top Ten by Weight
SPY’s ten largest companies held 39.6% on September 11, 2026. Compare two dated snapshots and check concentration in your own portfolio.
On this page
The ten largest companies held 39.6% of SPY's fund weight on September 11, 2026, up from 39.4% on August 10. These are PortLens calculations from State Street's dated holdings files for the S&P 500 tracking fund. Twenty-one companies reached half its weight in the newer snapshot. Your own concentration depends on the companies inside all the funds and stocks you hold.
How did concentration change between August and September 2026?
Top-ten company concentration rose 0.23 percentage points between the two snapshots. PortLens recomputed both from State Street's daily SPY holdings workbook, using the aggregation and effective-holdings arithmetic in our look-through methodology. The newer file's header says September 11, 2026; it was downloaded September 14.
| Measure | August 10, 2026 | September 11, 2026 |
|---|---|---|
| Ten largest companies, share classes combined | 39.39% | 39.62% |
| Ten largest listed security lines | 37.94% | 38.17% |
| Companies needed to reach 50% of fund weight | 22 | 21 |
| Effective holdings, mapped weights normalized | 43.3 | 42.4 |
Tesla and JPMorgan entered the company-level top ten; Eli Lilly and Berkshire Hathaway left it. A similar headline percentage can therefore contain different companies. These are two observations, with no measurement of the path between them or prediction of what follows.
Download the September top-ten weights or the two-snapshot calculation summary. The latter includes source-file hashes and the mapped weight totals: 99.900883% in August and 99.774344% in September. Both retain the same tiny Hologic contra line as a separate group and exclude cash; the definitions are detailed below. The top-ten percentages use published fund weights, without scaling to 100%. A tracking fund's holdings are a proxy for the index, so these aren't official S&P index weights.
For your own mix, a free concentration scan shows underlying position weights and coverage. The remaining tables and cumulative chart retain their original August and June dates.
How concentrated was the S&P 500 on August 10, 2026?
Ten companies held 39.4% of SPY's fund weight, and the top three alone held 20.3%. These are the ten largest, with each company's weight summed across every share class the fund lists. Figures computed by PortLens from State Street's published SPY holdings file, holdings as of August 10, 2026, using the arithmetic documented in our look-through methodology.
| # | Company | Ticker | Weight |
|---|---|---|---|
| 1 | NVIDIA | NVDA | 7.90% |
| 2 | Apple | AAPL | 6.79% |
| 3 | Alphabet | GOOGL / GOOG | 5.66% |
| 4 | Microsoft | MSFT | 5.64% |
| 5 | Amazon | AMZN | 4.08% |
| 6 | Broadcom | AVGO | 3.00% |
| 7 | Meta Platforms | META | 1.96% |
| 8 | Eli Lilly | LLY | 1.46% |
| 9 | Micron Technology | MU | 1.46% |
| 10 | Berkshire Hathaway | BRK.B | 1.45% |
| Total | 39.39% |
The file lists 504 non-cash lines. Combining Alphabet, Fox and News Corp share classes leaves 501 mapped groups: 500 companies and a Hologic contra line worth 0.000003% of the fund. That last line is retained separately in both snapshots; it doesn't change any rounded headline here. Alphabet's two large share classes explain the gap between the top-ten definitions.
Download the ten company weights (CSV). Adding the unrounded percentage weights gives 39.393476%, or 39.4% rounded. The download contains the inputs to this headline calculation; it is not the full issuer file.
We checked the retained spreadsheet again on September 14, 2026. Its header states August 10, 2026; the issuer link above now serves a changing daily file. The non-cash rows we used account for 99.900883% of fund weight. Cash is excluded; the small contra line described above is retained. The top-ten percentage uses the published fund weights without scaling them to 100%; effective holdings normalizes the 501 mapped weights over their mapped total before applying 1 / Σw².
| Definition, same August 10 file | Count | Top-ten weight |
|---|---|---|
| Non-cash security lines, including the contra line | 504 | 37.938623% |
| Mapped groups after merging the three dual share classes | 501 | 39.393476% |
Why do published top-ten figures disagree?
Because "top ten" has two definitions and one date, and most published figures state neither. Count Alphabet's two lines separately and the top ten comes to 37.9%, because two of the ten slots go to one company and Berkshire Hathaway is pushed out of the list. Count Alphabet once and it's 39.4%. Both are correct; they answer different questions.
The date matters at least as much. Vanguard's published constituent file for VOO — with equivalent files for VXUS, VUG, VB, VIG and VGT at the same URL after swapping the ticker — puts the top ten at 36.4% on the line-counting definition with holdings as of June 30, 2026. State Street's file six weeks later puts the same measure at 37.9%. These are different funds on different dates, so the gap cannot be assigned entirely to an index move.
That's why every figure in this article carries a source and an as-of date, and why a concentration number quoted without one isn't checkable. A PortLens scan sums each ticker across every fund and direct position you hold, so a company reached through three funds is one line rather than three. It doesn't merge a company's separate share classes — it lists them the way the index does.
What does the index look like past the top ten?
It thins out fast. The chart below plots the cumulative share of SPY's fund weight as you add companies from largest to smallest.
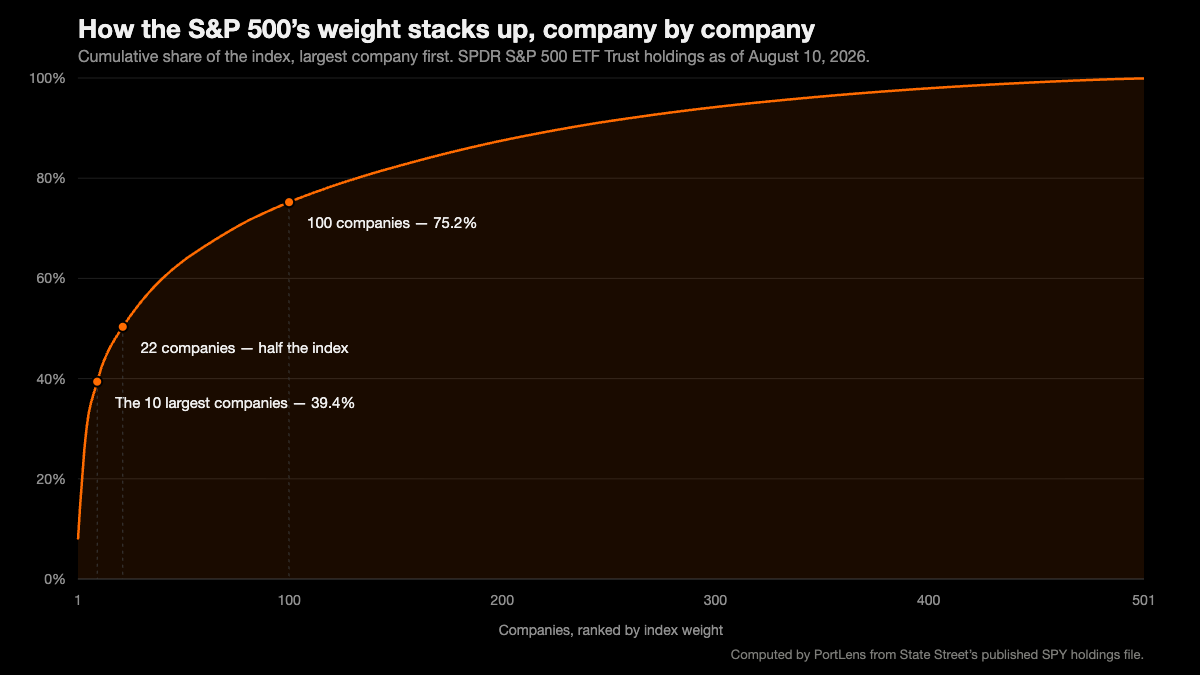
Twenty-two companies held half of SPY's weight. One hundred hold 75.2%. The smallest 250 companies — half the membership — hold 8.5% between them, and only 84 companies sit above the 0.20% each would carry if the index were equally weighted.
One number compresses all of that. Effective holdings — the inverse Herfindahl index, 1 / Σw², which weights each position by its size — gives the August SPY snapshot 43.3 equally weighted positions. Not 500. That measure is the reason a position count is a poor description of a portfolio, and it's the same one PortLens runs on yours; what real diversification means covers why the count and the effective number come apart.
Is there a level of concentration that counts as too much?
No, and nobody can hand you one. There's no threshold in standard finance literature that says an index or a portfolio becomes unsafe at some weight, and PortLens doesn't publish one either.
What exists is a regulatory reference point, and it was written for funds rather than for people. Article 52(2) of the UCITS Directive lets Member States raise the ordinary 5% same-issuer limit to no more than 10%, subject to a separate 40% aggregate rule (accessed August 11, 2026). That rule governs UCITS funds, not personal portfolios, so it's a point of reference and not a limit that applies to you.
PortLens marks a scan for attention when one company reaches 10%, one sector reaches 40%, the top ten positions reach 60%, or effective holdings fall to 10 or fewer. The 10% figure borrows the UCITS reference point above; the other three are transparent, round-number design choices rather than regulatory limits or fitted optima. Crossing one changes visual emphasis and nothing else — it isn't a risk grade or a signal to trade. On those markers the August SPY calculation sits below the top-ten cutoff at 39.4%, and its 43.3 effective holdings are far above the effective-holdings one. All investing involves risk, including possible loss of principal, and past performance does not guarantee future results.
How much of your own portfolio is the index's top ten?
Less than the index in some mixes, more in others — which is the point of measuring rather than assuming. Below are three portfolios run through the same look-through arithmetic PortLens documents in our look-through methodology, using Vanguard's published constituent files with holdings as of June 30, 2026, against the index's ten largest companies as of August 10, 2026. The two dates are six weeks apart; this is a historical comparison, not a current scan result. "Its own top ten" counts share-class lines the way a scan does; "the index's ten largest" is the company-level list from the table above.
| Portfolio | Companies owned | Effective holdings | Its own top ten | The index's ten largest |
|---|---|---|---|---|
| VOO alone | 501 | 51.7 | 36.4% | 37.5% |
| VOO 40% / VXUS 20% / VUG 15% / VB 15% / VIG 10% | 3,626 | 107.7 | 25.0% | 25.2% |
| VOO 50% / VUG 20% / VGT 20% / VXUS 10% | 2,716 | 40.0 | 39.6% | 39.7% |
Four funds added around an S&P 500 holding cut the index's ten largest from 37.5% of the money to 25.2%, and took effective holdings from 51.7 to 107.7. Adding a growth fund and a technology fund instead moved both the other way: 39.7% and 40.0, from a portfolio holding 2,716 companies.
The routes are what a holdings list can't show. In the five-fund mix, NVIDIA is 4.89% of the portfolio and arrives through two funds; Apple is 4.80% and arrives through three, as 2.64% via VOO, 1.75% via VUG and 0.42% via VIG. Nobody bought VIG for Apple. The pairwise view is narrower and easier to check — VOO and VUG publish their shared holdings and weights — but a pair can't show a name arriving through three funds at once, which is the difference between ETF overlap and a whole-portfolio look-through.
What does the top-ten number not tell you?
It's a holdings measure, and its edges matter because the figure reads as more authoritative than it is.
- It says nothing about returns or correlation. Whether two positions move together is estimated from returns over a stated window; a weight is not an estimate of anything future.
- It's a snapshot. Every figure here carries its file's as-of date because index weights drift daily and reconstitutions move them in steps.
- The September update compares two retained files. It doesn't establish a daily trend; the app's current-per-fund cache supplies no intervening history.
- Portfolio figures are bounded by constituent coverage. When the issuer's own daily holdings file or the fund's SEC N-PORT filing resolves, a scan uses every constituent that real source publishes rather than a fixed slice of the largest positions; a small set of funds — chiefly UCITS/LSE listings such as CSPX.L and VUSA.L, which file no N-PORT — instead fall back to a curated approximate top-ten, and for those the scan sees only that approximation, with the coverage ratio not capturing that missing tail. The look-through coverage ratio counts a fund as covered when its constituent list is available, even when that list is partial. Missing exposure can understate top-ten weights and make effective holdings appear higher. The three historical portfolios above use full issuer files; their 100% look-through coverage does not mean the published weights cover every fraction of fund assets.
- International funds are the weak spot. Look-through is strongest for US large-cap funds; a fund that can't be resolved contributes nothing and shows up in the coverage ratio instead of your top ten.
- It doesn't know what you meant to build. A 39.6% top ten is a fact about a portfolio, not a verdict on it.
How do you measure concentration in your own portfolio?
Type your holdings in and read the look-through. A free PortLens scan computes effective holdings, the share of your money in your ten largest underlying positions, how many of your funds each of those companies arrives through, and the coverage ratio behind all three, with no account required to start.
Entry is manual. PortLens connects to no broker and has no CSV import, so each ticker and share count is typed by hand — a minute for five lines, longer for forty. A scan traces each weight to a published holdings file when one is available. If PortLens can resolve a fund only from its hand-maintained static mapping, the scan labels that fund's data approximate. Read the coverage ratio before the concentration figures, and look at the fund count beside each large company: a name arriving through three funds is one decision wearing three costumes.
Key takeaways
- SPY's ten largest companies held 39.6% on September 11, 2026, versus 39.4% on August 10. Counting listed share-class lines separately gives 38.2% and 37.9%, respectively.
- Twenty-one companies reached half of SPY’s weight in the September snapshot, versus 22 in August. Effective holdings fell from 43.3 to 42.4 on the same calculation basis.
- A concentration figure without a definition and an as-of date can't be checked. VOO's June 30 holdings file reads 36.4% on the line-counting definition.
- Owning funds around an S&P 500 position moves your exposure to those ten names in either direction: 25.2% for one five-fund mix, 39.7% for a growth-tilted one, against 37.5% for the S&P 500 fund alone.
- No threshold in standard finance literature says how much is too much. The UCITS Directive's 5%-to-10% same-issuer limit is a reference point written for funds, and PortLens's own markers are design choices that change visual emphasis only.
Revision note, September 14, 2026: added a September 11 snapshot alongside the retained August file and downloadable arithmetic for both; clarified share classes, the retained contra line, current share-count input and per-fund coverage. Historical examples retain their original dates.
This article is for information and education only and is not investment advice. Analytics referenced are computed as described in our methodology; see our disclosures.