
How to Find ETF Holdings and Check Your Real Exposure
Most ETFs publish full holdings daily. Learn where to find the data, how to read the weights, and how a free look-through on real SEC N-PORT filings reveals the cross-fund exposure a brokerage statement misses.
Most ETFs publish what they own every day, down to the last stock and its exact weight. The issuer posts a holdings file on its website, and the SEC requires a quarterly filing with nearly every position's name, share count and market value; both are free. To combine several funds, a free PortLens scan adds each company's weight inside the funds it can read to any shares you own outright, for up to 5 holdings with no account.
- A fund's ten largest positions can hold more than a third of its assets. The weight column, not the name list, tells you where the money sits.
- Across several funds, a portfolio-level look-through sums every route to every company and reports one combined weight per company.
Terms used here
- Look-through: adding up each company's weight inside every fund you hold into one combined figure per company.
- Effective holdings: a money-weighted count (1 ÷ sum of squared weights) showing how concentrated the weight is, as opposed to a simple ticker count.
Where does an ETF publish its holdings?
The issuer's product page is the fastest route. Vanguard, BlackRock (iShares), State Street (SPDR) and Invesco all publish daily holdings for their index ETFs, usually as a downloadable CSV or Excel file with every position's exact weight.
SEC EDGAR carries the official quarterly snapshot. Registered US funds file Form N-PORT, which reports nearly every holding with its market value, share count and percentage of net assets. These filings are public on EDGAR: search the fund or trust name, then filter to form type NPORT-P. Funds report monthly, but only each fiscal quarter's final month becomes public, up to 60 days later, so the data can be two to five months old by the time you read it. A 2024 rule for monthly publication has not taken effect, and the SEC's February 2026 proposal would keep publication quarterly (SEC Release No. IC-35962, February 18, 2026; the 2024 rule was delayed to November 2027 at the earliest by SEC Release IC-35538, April 2025).
Not every ETF discloses daily. SEC Rule 6c-11 (September 2019) requires daily website portfolio transparency for most open-end ETFs, but nontransparent active ETFs cannot rely on the rule and operate under separate SEC orders that do not require daily holdings disclosure (SEC press release 2019-190, September 26, 2019; on the separate orders, SEC Release IC-35962, page 67). Those funds still file the quarterly N-PORT, but their holdings between filings are not public.
| Source | Completeness | Freshness | Format |
|---|---|---|---|
| Issuer product page | Full holdings list (most index ETFs) | Daily | Web page, CSV or Excel download |
| SEC EDGAR N-PORT | Nearly every position, with market value | Quarterly, 60-day delay | XML, machine-readable |
For a single fund, the issuer's daily file is fresher than the quarterly SEC record. The N-PORT filing is the one to cite when you need a verifiable date or a machine-readable list.
What should you look at inside a holdings list?
The name list matters less than the weights beside it. Vanguard's S&P 500 ETF (VOO) held 505 stocks as of September 30, 2026, but the ten largest accounted for 40.6% of net assets, with NVIDIA leading at 8.4% (Vanguard fact sheet F0968, September 30, 2026 edition). Sort by weight, top to bottom.
Three columns do most of the work:
- Weight (% of net assets) shows how much of each dollar in the fund goes to that stock. If both stocks rise 10%, an 8.4% position adds 0.84 percentage points to the fund and a 1% position adds 0.1.
- Sector shows whether the fund leans one way. VTI held 3,519 stocks as of September 30, 2026, but Technology alone was 43.1% under ICB (Vanguard fact sheet F0970, September 30, 2026 edition). VOO's Information Technology was 39.7% under GICS. The two use different classification systems, so check each fund's scheme before comparing sectors.
- Holdings count tells you the fund's breadth without saying anything about its concentration; effective holdings, described in our methodology, measure that.
The weights carry the signal. In a fund whose top ten hold 40.6%, each of those ten moves the fund more than any single name outside them, though everything else together still holds 59.4%.
Why does one fund's holdings list fall short when you own several?
Because your portfolio's real exposure is the sum of every route to every company, across all your funds. If you hold VTI (total US market) and QQQ (Nasdaq-100), both funds own NVIDIA, Apple and Microsoft. Either fund's page tells you what that fund holds, but not how much NVIDIA you own in total: its weight inside QQQ times your allocation to QQQ, plus the same for VTI, plus any shares you bought outright.
Consider a portfolio of 35% SCHD, 30% QQQ, 25% VTI and 10% MSFT. SCHD's May 31, 2026 filing lists no Apple, NVIDIA or Amazon, so your entire exposure to those mega-caps flows through just two of your four holdings. QQQ and VTI overlap 48.2% by weight (holdings as of June 30, 2026), because most of QQQ's Nasdaq-100 companies also sit in VTI's US market index.
A PortLens look-through scan of that portfolio, computed October 13, 2026 from SEC N-PORT filings (SCHD as of May 31, QQQ and VTI as of June 30, 2026), reports Microsoft at 12.26% of the combined portfolio. The direct 10% MSFT holding accounts for most of that, but Microsoft's weight inside QQQ and VTI adds another 2.26 percentage points. NVIDIA follows at 3.87%, arriving through QQQ and VTI alone. Apple is 3.47%, also through two funds. The top ten underlying companies hold 34.11% of the portfolio, and the scan could see inside all three funds (100% coverage). All investing involves risk, including possible loss of principal, and past performance does not guarantee future results.
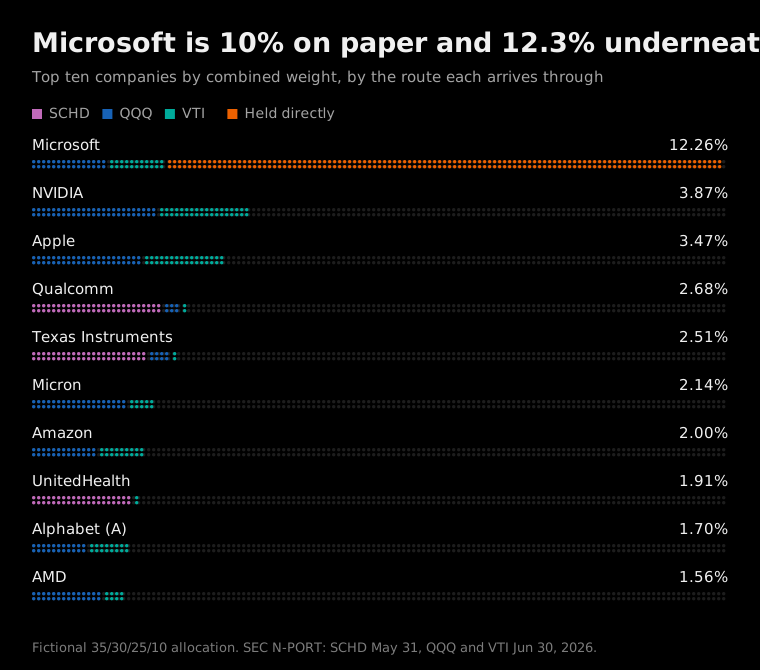
Top ten underlying companies in the example portfolio. Each bar's colors show how much weight arrives through each fund and how much is held directly. Fictional allocation; methodology and calculation inputs.
Microsoft's 12.26% combined weight, computed October 13, 2026 from three N-PORT filings, reads as a 10% position on a brokerage statement because the extra 2.26 percentage points arrive inside two index funds. That hidden layering is the gap between "what does this ETF hold?" and "what do I actually own?"
How do you check your combined exposure across multiple funds?
A portfolio-level look-through reads each fund's published holdings, multiplies every stock's weight by your fund allocation, and sums each company across all positions. It answers three questions a single holdings list cannot:
- Which companies your money is concentrated in, across funds and direct stocks combined.
- How many effective holdings you have: that four-position portfolio holds 3,505 identified holdings (Alphabet's two share classes count twice) but behaves like roughly 39 equally weighted ones.
- What share of the portfolio sits in funds whose holdings could be read, so you know which parts rest on filed data.
A free PortLens scan accepts up to 5 holdings without an account, reads each fund's full constituent list, and shows your ten largest underlying holdings by combined weight, plus effective holdings, with low coverage flagged. It also takes US mutual funds such as VFIAX beside ETFs and stocks, and looks inside each fund it can identify. For just two funds, the free two-fund overlap check gives their overlap by weight for supported pairs. The methodology describes every step, and our look-through explainer walks through reading the result.
Morningstar's X-Ray tool also runs a look-through, inside the paid Morningstar Investor subscription at $249 a year in the US (accessed October 28, 2026); Morningstar said it would retire its free standalone X-Ray tools on its Europe, Canada and Asia sites (Morningstar, April 15, 2025). See PortLens vs Morningstar X-Ray. ETF Research Center has a free two-fund overlap checker (full results need a free account) and full holdings for supported ETFs on its $29-a-month Individual tier (accessed October 28, 2026); see PortLens vs ETF Research Center.
Whichever tool you use, the coverage and filing dates matter as much as the headline figure, because a look-through is only as current as its oldest constituent file.
What are the limits of a holdings-based look-through?
A look-through sees only what each fund files, only as of the filing date, and nothing about how the holdings move together.
First, constituent coverage is bounded by what the fund files. In PortLens, a fund without a supported holdings source contributes no underlying holdings, and the scan flags the gap when coverage falls below roughly 75%.
Second, the data is a dated snapshot. SEC filings are quarterly with a delay, and even daily issuer files are yesterday's close. A number without a date is a number you cannot verify.
Third, holdings say nothing about returns. High overlap means two funds own the same stocks, but low overlap does not guarantee low correlation: funds holding different companies can still fall together in a broad sell-off, because different holdings are not the same as different risks.
Fourth, share classes appear as separate rows. Alphabet is listed as both GOOGL and GOOG in the QQQ and VTI filings used here, under separate CUSIPs, so the look-through splits its footprint across two lines.
A look-through figure earns trust by showing three things: its filing dates, its coverage, and what it could not see. Leave any of them out and the reader has no way to check the number.
How do you look up what your ETFs hold right now?
Start with the issuer's page for a single fund: download the full holdings file, read the weights column and check the date at the top.
To check one company by hand, say NVIDIA in a portfolio of VOO, VTI and some NVIDIA shares, multiply each fund's share of your portfolio by NVIDIA's weight inside it: 8.4% of VOO and 7.1% of VTI on Vanguard's September 30, 2026 fact sheets. Then add the portfolio share you hold in NVIDIA directly.
For the combined picture across several funds, run a free portfolio scan. Enter your tickers and share counts; up to 5 holdings need no account. The result shows your ten largest underlying holdings by combined weight and flags low coverage.
Key takeaways
- Most ETFs publish their full holdings list daily on the issuer's website; SEC EDGAR carries the official quarterly filing. Nontransparent active ETFs are the exception to daily disclosure.
- Read the weights, not the names. A fund's ten largest positions can hold a third or more of its assets while hundreds of smaller holdings barely register.
- A portfolio-level look-through multiplies each company's fund weight by your allocation and sums across every route to give one total per company.
- Every look-through figure is bounded by its constituent coverage and the age of the filings behind it. Read both before treating the concentration numbers as complete.
How were these figures computed?
The worked example uses a fictional allocation of 35% SCHD, 30% QQQ, 25% VTI and 10% MSFT. Constituent data comes from SEC N-PORT filings: SCHD as of May 31, 2026; QQQ and VTI as of June 30, 2026. The look-through was computed October 13, 2026 by the PortLens scan, which reads each fund's full constituent list with no holding-count cap; share counts were sized so each position was worth exactly its allocation at that day's prices. Each chart segment is the fund's allocation times the company's weight in that fund's N-PORT filing, and the segments add up to the scan's combined figure for all ten companies. The calculation inputs file holds the per-fund figures, and the full scan record holds the request, the response and the three filing links. Fund facts (holdings counts, top-ten and NVIDIA weights, sectors) come from Vanguard fact sheets F0968 and F0970, September 30, 2026 editions, downloaded October 28, 2026.
This article is for information and education only and is not investment advice. Analytics referenced are computed as described in our methodology; see our disclosures.