
How Do I Know If My Portfolio Is Balanced?
Three checks show whether your portfolio is balanced: how concentrated it is, what you own once your funds are opened up, and whether your holdings fall together.
Your portfolio is balanced when three things hold: no single company carries it, the combined picture after opening up your funds matches what you think you own, and its parts don't all fall together on the same bad day.
Why is balance so hard to see across multiple accounts?
PortLens started with this problem: a portfolio that looked something like an S&P 500 fund plus Alphabet, Tesla and Amazon shares, spread across brokerages, with a spreadsheet that showed only the total value. Each brokerage shows its slice and has no idea what you hold elsewhere. Your index fund at one firm can own the same companies as the shares at another, and neither statement mentions it. The imbalance hides in the gaps between accounts and inside funds.
Does any one company carry your portfolio?
On September 11, 2026, SPY, State Street's S&P 500 tracking fund, had 39.6% of its weight in its ten largest companies, according to PortLens calculations from State Street's dated holdings file. An S&P 500 fund is 500 companies on paper and a heavy ten-company position in practice.
Concentration compounds when several funds lean on the same leaders. The S&P 500 concentration breakdown walks through the dated figures.
How much concentration is too much?
There's no universal limit for a personal portfolio, but there is a published reference point. Article 52(2) of the EU's UCITS Directive sets an ordinary 5% limit on a fund's exposure to a single issuer, which Member States may raise to no more than 10% (accessed August 11, 2026). It's written for funds, not individuals, but it makes a useful yardstick.
PortLens marks a scan for attention when one company reaches 10%, the top ten positions reach 60%, or effective holdings fall to 10 or fewer. These are design choices, not regulatory limits or signals to trade. More useful than any threshold are the questions you can ask of your own number:
- Which company is your largest after look-through, and did you buy it on purpose?
- How much of that weight arrived through funds you bought for a different reason?
- If that one company had a bad year, how much of your portfolio would feel it?
What do you actually own once your funds are opened up?
The second check is look-through: adding up every company inside every fund, plus anything held directly, to get one combined list. For two funds at a time, the free ETF overlap checker shows how much of their weight they share.
A worked example: the spreadsheet that started PortLens
Give that spreadsheet portfolio illustrative weights:
- 70% in an S&P 500 fund (VOO here)
- 10% each in Alphabet, Tesla and Amazon shares
On paper that's 70% across 500 companies and 30% in three stocks, but the fund owns those three too. In VOO's SEC filing with holdings as of June 30, 2026, shown on its overlap page, Alphabet was 5.84% of the fund across its two share classes (3.25% GOOGL and 2.59% GOOG), Amazon 3.62% and Tesla 1.84%. Multiply each by the fund's 70% and add the direct holdings:
- Alphabet: 70% × 5.84% = about 4.1 percentage points, plus 10, for roughly 14.1%
- Amazon: 70% × 3.62% = about 2.5 percentage points, plus 10, for roughly 12.5%
- Tesla: 70% × 1.84% = about 1.3 percentage points, plus 10, for roughly 11.3%
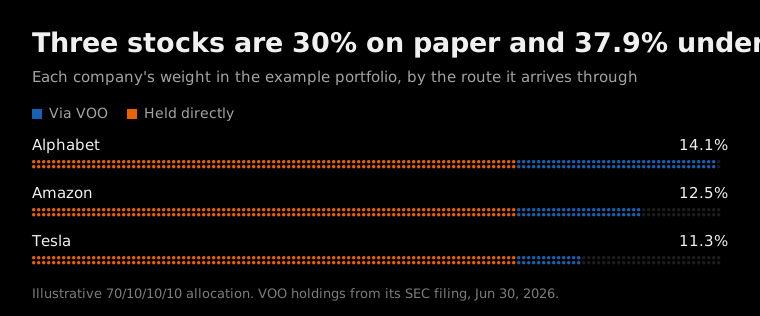
Each bar splits a company's weight into the shares held directly and the part arriving through VOO. Illustrative allocation; methodology.
Those three come to about 37.9% of the portfolio, against the 30% the spreadsheet showed. Each sits above the 10% single-company marker, and the fund bought for breadth added nearly 8 percentage points to the same three names.
The look-through methodology documents how a scan does the same sum across every holding, with one difference: a scan lists Alphabet's two share classes as separate lines. If the shares held directly are GOOGL, it shows about 12.3% GOOGL and 1.8% GOOG, which add up to the 14.1% above.
What does effective holdings add?
Effective holdings is 1 divided by the sum of every squared weight, telling you how many equal-sized positions would give the same concentration. In a PortLens calculation (holdings as of June 30, 2026), a growth-heavy four-fund mix (50% VOO, 20% VUG, 20% VGT, 10% VXUS) holding 2,716 companies came out at just 40.0 effective holdings. The combined list shows who you own; effective holdings shows how many of them are doing the work.
Would your holdings all fall on the same bad day?
The third check moves from what you own to how it behaves. Two holdings can share almost no companies and still drop together, the failure mode look-through alone can't catch.
VTI and VXUS overlap by just 0.2% of weight (holdings as of June 30, 2026), since VTI holds US companies and VXUS holds companies outside the US. Yet in PortLens calculations over the five years to August 2026, their daily returns correlated at 0.81, and across the US market's 125 worst days, every session in which a total-market fund fell more than 1.24%, both closed lower 98% of the time. Different companies, different currencies, same direction when it counted.
Correlation, beta and factor exposure each measure a piece of that question; the guides on portfolio beta, factor exposure and diversification beyond sector splits go deeper.
How do I check whether my own portfolio is balanced?
Balance is a property of the whole portfolio, so a check on one account answers a smaller question than the one you're asking.
- List every holding from every account, with share counts.
- Run look-through and read your largest combined positions, top-ten share and effective holdings.
- Compare what you found with what you meant to own; note any company that arrived mainly through funds.
- Check how your holdings have moved together: correlations, or how often they fell on the same days.
The free PortLens Scan runs the middle two steps without an account: it reads each eligible fund's full constituent list and combines it with your direct holdings to show concentration and effective holdings. A free account adds correlations and sector exposure.
Key takeaways
- Scattered accounts hide imbalance, because no brokerage can see your holdings at another.
- An S&P 500 fund put 39.6% in its ten largest companies on September 11, 2026, so index funds carry concentration of their own.
- An index fund stacks weight on top of stocks you already own: in the example, 30% in three stocks became about 37.9% once the S&P 500 fund was opened up.
- Low holdings overlap doesn't guarantee independent behavior; VTI and VXUS share 0.2% of weight (holdings as of June 30, 2026), yet in the five years to August 2026 both declined on 98% of the 125 worst US market days.
This article is for information and education only and is not investment advice. Analytics referenced are computed as described in our methodology; see our disclosures.